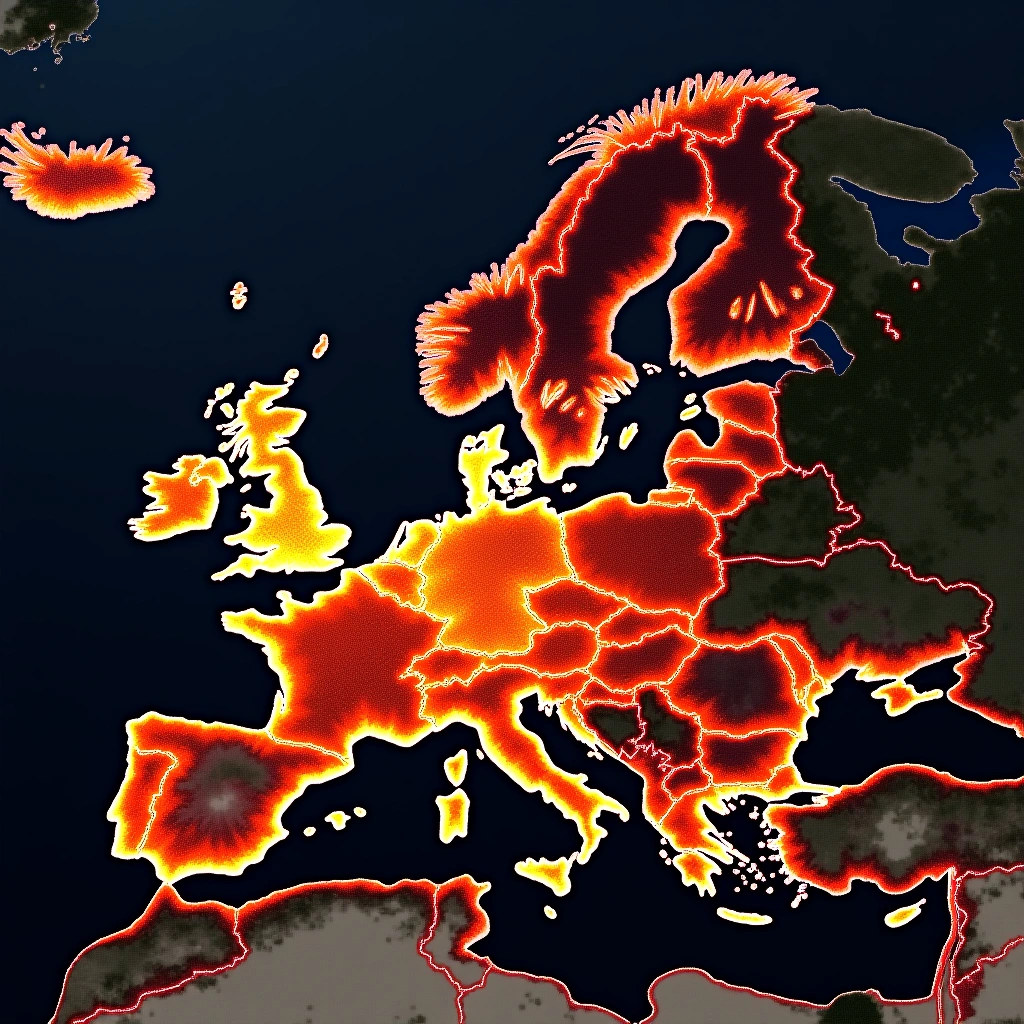
If you thought tracking wildfires was as easy as a game of hide and seek, think again! This year, Europe has been feeling the heat—literally—with wildfires scorching vast areas and creating a smoke cloud that could probably be seen from space. Oh wait, it can be seen from space! Thanks to the Copernicus program, Europe’s free satellite service, we now have a nifty tool to visualize these wildfires like never before.
The Mediterranean countries consistently record the largest burnt areas — Portugal, Spain, Italy, Greece and increasingly France, Croatia and the Balkans. Hot, dry summers, flammable pine and scrub vegetation, and abandoned rural land make southern Europe especially fire-prone, though large fires now also occur further north.
So, what exactly is Copernicus? Well, it’s not just a fancy name for your uncle’s telescope. Copernicus is the European Union’s Earth observation program that provides data to monitor our planet’s environment. And now, they’ve added wildfire visualization to their arsenal just in time for this record-breaking wildfire season. Because who doesn’t love a good tech upgrade?
You might be wondering why this matters. Well, wildfires are not just a summer barbecue gone wrong; they can have devastating effects on ecosystems, air quality, and even human health. With the Copernicus Browser, you can now track wildfires in near-real-time, which is a game changer for firefighters, environmentalists, and anyone who doesn’t want to be caught in a smoky haze while enjoying their outdoor picnic.
The new feature allows users to see the extent of wildfires, their progression, and even how they interact with the surrounding environment. It’s like having a GPS for wildfires—minus the annoying voice telling you to make a U-turn. Instead, it provides crucial data that can help with firefighting efforts and inform the public about air quality issues. Think of it as your new best friend in the battle against wildfires.
Using the Copernicus Browser is as easy as pie (and we all know pie is easy). You just hop onto the website, navigate to the wildfire section, and voilà! You can see a detailed map showing the areas affected by wildfires, along with satellite imagery that looks like it was pulled straight from a sci-fi movie.
In a world where we can track a pizza delivery in real-time, it’s about time we had the same capabilities for tracking wildfires. This development is a perfect example of how technology can be harnessed for good. So, while you’re scrolling through social media and wondering why your friend’s cat has more followers than you, remember that we’re also making strides in environmental monitoring.
But let’s not forget, wildfires are still a serious issue. They can wreak havoc on communities and wildlife. So while we’re sitting back and marveling at the technology, let’s also do our part to prevent these disasters. Whether it’s being careful with campfires or supporting policies that protect our forests, every little bit helps.
In conclusion, the Copernicus Browser’s wildfire visualization tool is a fantastic addition to our efforts in monitoring and fighting wildfires. It’s a reminder that while we may be living in a chaotic world, technology can still bring us some hope—and maybe allow us to enjoy our summer barbecues without the added drama of a wildfire lurking nearby. So, let’s raise a glass to technology, and to the brave souls fighting the flames! Cheers!
Inspired by: “Europe’s free satellite service just made it easier to track wildfires | Copernicus Browser adds wi…” (r/technology)